0%

【iOS逆向】LLDB动态调试

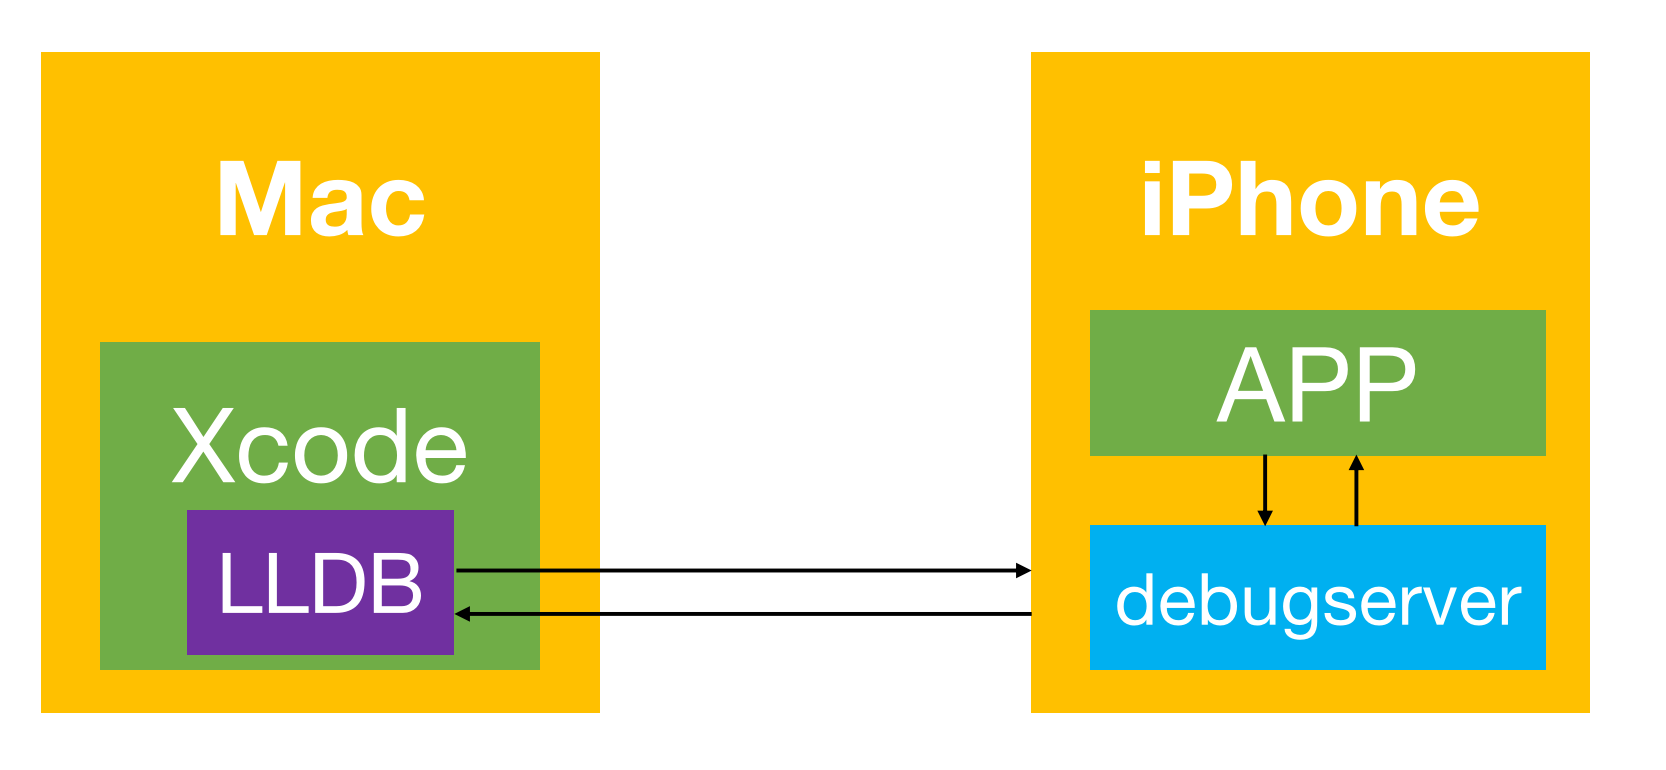
正向开发的时候通常是使用xcode对app进行调试,我们先来看看xcode的调试流程

  • 手机启动app进程
  • 手机启动debugservice服务,debugserver附加到App进程
  • 调试器lldb通过连接debugservice进行调试

debugservice

Xcode调试用到的debugservice位于/Applications/Xcode.app/Contents/Developer/Platforms/iPhoneOS.platform/DeviceSupport/13.2/DeveloperDiskImage.dmg这个dmg下面,打开后可以在usr/bin/debugserver找到

当手机第一次通过xcode调试时,会把该文件拷贝到手机/Developer/usr/bin/debugserver下,未使用xcode调试过的手机没有该文件,这个程序只能调试通过xcode安装的app,无法调试从商店下载的app,为了调试其他的App,我们需要修改它的权限,把下面权限签到可执行文件

1
2
3
4
5
6
7
8
9
10
11
12
13
<!DOCTYPE plist PUBLIC "-//Apple//DTD PLIST 1.0//EN" "http://www.apple.com/DTDs/PropertyList-1.0.dtd">
<plist version="1.0">
<dict>
<key>com.apple.springboard.debugapplications</key>
<true/>
<key>get-task-allow</key>
<true/>
<key>task_for_pid-allow</key>
<true/>
<key>run-unsigned-code</key>
<true/>
</dict>
</plist>

使用ldid签名

1
2
3
4
5
6
7
8
9
10
# 安装ldid
brew install ldid

# 从原来的debugserver导出权限文件
ldid -e debugserver > debugserver.entitlements

# 修改debugserver.entitlements,换成上面文件的内容

# 重新签名
ldid -Sdebugserver.entitlements debugserver

得到新的debugserver,传到手机/user/bin/debugserver上,这样可以直接在命令行使用

1
scp debugserver root@xx.xx.xx.xx:/user/bin/

还需要给debugserver添加可执行权限

1
chmod +x debugserver

调试

1. debugserver附加到进程

debugserver附加到App进程上,指定端口号进程

1
2
3
4
5
6
7
8
9
10
debugserver 127.0.0.1:端口号 -a 进程id/进程名称

# 如调试器附加到微信进程,端口号随机,只要没有被占用都可以
debugserver 127.0.0.1:3333 -a WeChat

# 附加成功后会等待链接,输出下面字符
debugserver-@(#)PROGRAM:LLDB PROJECT:lldb-900.3.98
for arm64.
Attaching to process WeChat...
Listening to port 3333 for a connection from localhost...

我们如果直接使用xcode自带的debugserver来操作的话,会报下面错误,原因是debugserver权限不足

1
2
3
4
5
debugserver-@(#)PROGRAM:LLDB  PROJECT:lldb-900.3.98
for arm64.
Attaching to process wework...
error: failed to attach to process named: "" unable to start the exception thread
Exiting.

iOS12 下配置debugserver + lldb调试环境的小技巧和问题处理

2. debugserver启动调试

如果App没有运行,可以直接启动App调试

1
2
# 后面接的是完整路径
debugserver -x auto xx.xx.xx.xx:3333 /private/var/containers/Bundle/Application/B7984908-D77C-47AE-97AF-3803988F1401/Test.app/Test

通过lldb连接调试器

1
2
3
4
5
6
7
8
9
10
11
12
13
14
15
16
17
18
# 进入lldb模式
$ lldb
# 连接调试器
(lldb) process connect connect://xx.xx.xx.xx:3333

# 链接成功后,会输出下面信息
Process 40349 stopped
* thread #1, queue = 'com.apple.main-thread', stop reason = signal SIGSTOP
frame #0: 0x0000000181971198 libsystem_kernel.dylib`mach_msg_trap + 8
libsystem_kernel.dylib`mach_msg_trap:
-> 0x181971198 <+8>: ret

libsystem_kernel.dylib`mach_msg_overwrite_trap:
0x18197119c <+0>: mov x16, #-0x20
0x1819711a0 <+4>: svc #0x80
0x1819711a4 <+8>: ret
Target 0: (WeChat) stopped.
(lldb)

这个时候进程会被暂停,可以使用continue让程序继续走

可能会出现下面问题

1
2
(lldb) process connect connect://xx.xx.xx.xx:12121
error: Failed to connect port

如果出现上面问题,可以通过端口转发到本地,使用USB端口转发速度也会更快,ip换成localhost

1
iproxy 2333 3333

接下来使用lldb命令即可,与xcode调试一样

退出调试

1
(lldb) exit

每次连接调试的时候都很麻烦,我们可以通过别名来简化连接,如下

1
2
3
4
5
# 使用 con 代替 process connect connect://xx.xx.xx.xx:12121
(lldb) command alias con process connect connect://xx.xx.xx.xx:12121

# 接下来就可以直接使用con连接
(lldb) con

lldb常用命令

  • 列出所有断点:breakpoint list, br li
  • 打开、关闭某个断点:breakpoint enable, breakpoint disable, br dis, br del
  • 打印参数:frame variable, fr v
  • 打印方法名和行数:frame info
  • 打印寄存器的值:register read
  • 修改寄存器的值:register write rax 123
  • 列出文件加载基地址:image list
  • 执行地址的加减运算:p/x

反调试

使用ptrace函数反调试

debugserver之所以可以调试APP, 是依赖一个系统函数ptrace(process trace 进程跟踪). 此函数提供了一个进程监听控制另外一个进程, 并且可以检查被控制进程的内容和寄存器里面的数据. 可以用来实现断电调试和系统调用跟踪. iOS中没有提供此函数的头文件, 但不是私有API.

ptrace函数在iOS项目中不能找到,在MacOS工程可以引用到,我们把需要用到的函数声明搬过来

1
2
3
4
5
6
7
8
9
10
11
12
13
14
15
16
17
18
19
20
21
22
23
24
25
/**
* request: 要做的事情
* pid: 要监听/操作的id
* addr: 为request代表的操作提供的地址
*/
ptrace(int _request, pid_t _pid, caddr_t _addr, int _data)

#define PT_TRACE_ME 0 /* child declares it's being traced */
#define PT_READ_I 1 /* read word in child's I space */
#define PT_READ_D 2 /* read word in child's D space */
#define PT_READ_U 3 /* read word in child's user structure */
#define PT_WRITE_I 4 /* write word in child's I space */
#define PT_WRITE_D 5 /* write word in child's D space */
#define PT_WRITE_U 6 /* write word in child's user structure */
#define PT_CONTINUE 7 /* continue the child */
#define PT_KILL 8 /* kill the child process */
#define PT_STEP 9 /* single step the child */
#define PT_ATTACH ePtAttachDeprecated /* trace some running process */
#define PT_DETACH 11 /* stop tracing a process */
#define PT_SIGEXC 12 /* signals as exceptions for current_proc */
#define PT_THUPDATE 13 /* signal for thread# */
#define PT_ATTACHEXC 14 /* attach to running process with signal exception */
#define PT_FORCEQUOTA 30 /* Enforce quota for root */
#define PT_DENY_ATTACH 31
#define PT_FIRSTMACH 32 /* for machine-specific requests */

找地方执行,可以在load方法

1
2
3
4
+ (void)load {
// PT_DENY_ATTACH 表示拒绝调试
ptrace(PT_DENY_ATTACH, getpid(), 0, 0);
}

使用sysctl函数反调试

使用sysctl函数可以判断当前程序是否正在被调试,需要隔一段时间检测一下

1
2
3
4
5
6
7
8
9
10
11
12
13
14
15
16
17
18
19
20
21
22
23
24
25
#import <sys/sysctl.h>

bool isDebuging() {
// 控制码
int name[4]; // 里面放字节码, 查询信息
name[0] = CTL_KERN; // 内核
name[1] = KERN_PROC; // 查询进程
name[2] = KERN_PROC_PID; // 通过id查询, 传递的参数是进程id
name[3] = getpid(); // 拿到当前进程id

struct kinfo_proc info; // 结束进程查询结果的结构体
size_t info_size = sizeof(info); // 结构体的大小

int error = sysctl(name, sizeof(name)/sizeof(*name), &info, &info_size, 0, 0);

if (!error) {
// p_flag 的值转换为二进制, 假如从低位到高位第12位的值为1(0x800), 则正在被调试
if (info.kp_proc.p_flag & P_TRACED) {
return true;
} else {
return false;
}
}
return false;
}

反反调试

上面反调试方法都是C语言的方法,而我们知道fishhook可以 hook C方法,所以上面两个方法可以被fishhook替换掉

这时候我们就需要让系统的C方法不被hook,我们可以在别人hook之前换成我们自己的实现,然后别人再hook的时候就只是hook我们替换过的实现了,如何确保我们的hook在别人之前调用

我们知道,dyld加载App的时候,动态库是先加载的,而动态库的加载顺序是根据MachO文件描述的顺序(XCode中编译的顺序一样,也就是Frameworks,Libraries,and Embedded Content配置的顺序),我们可以用一个防护的动态库让我们的动态库先执行

当然如果MachO文件的动态链接库的顺序被改变了,还是会被别人先hook,这个成本就比较高了